CSE/EE 485: Digital Image Processing IComputer Project Report # : Project 3Fourier Transform and Frequency Domain Filter DesignGroup #4: Isaac Gerg, Pushkar DurveDate: November 4, 2003 |
|
|
|
|
| A. |
Objectives
|
| B. |
Methods There is one 'M' file for this project. project3.m contains four parts.
1. 2D FFT Executing project3.m from Matlab At the command prompt enter:
|
| C. |
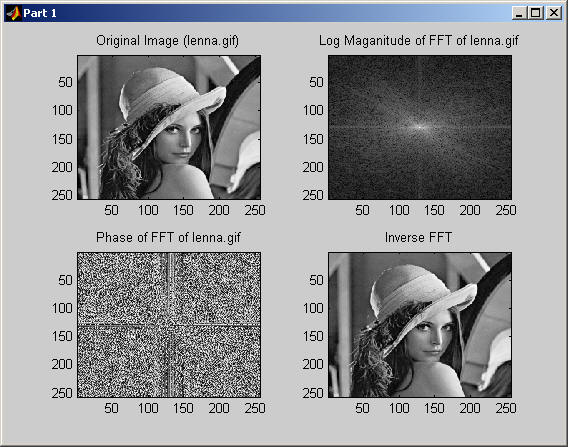
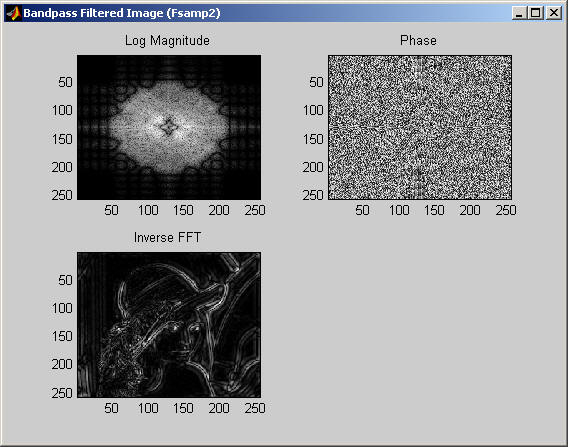
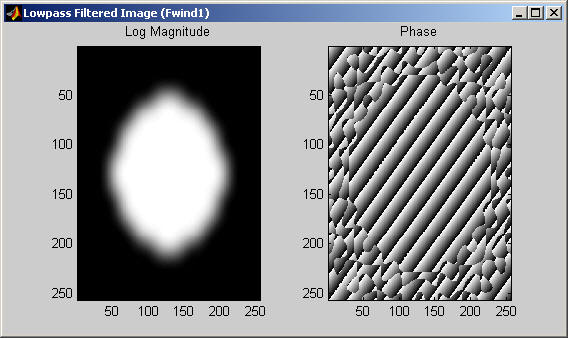
Results Image file names in parentheses. Results described in order following Methods section above. Part 1:
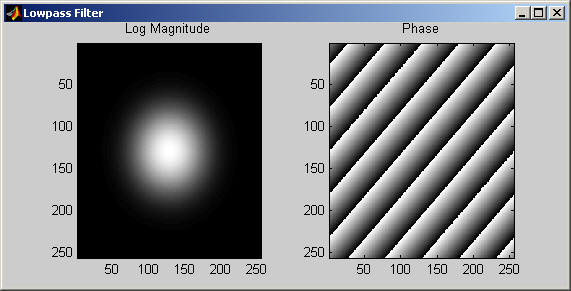
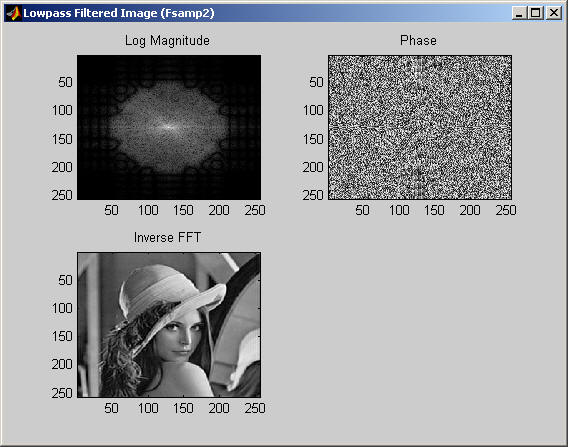
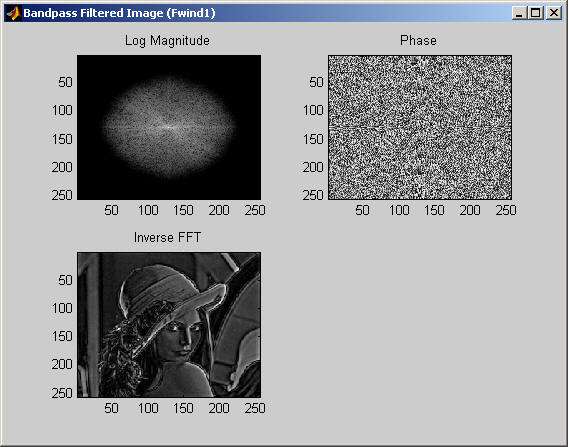
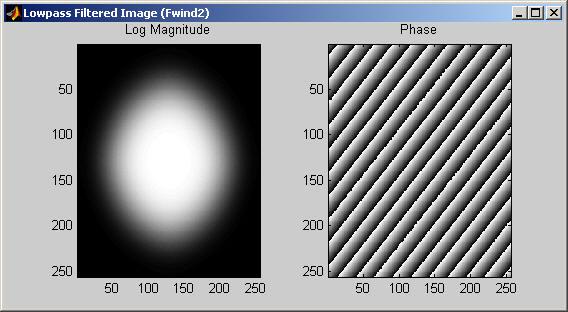
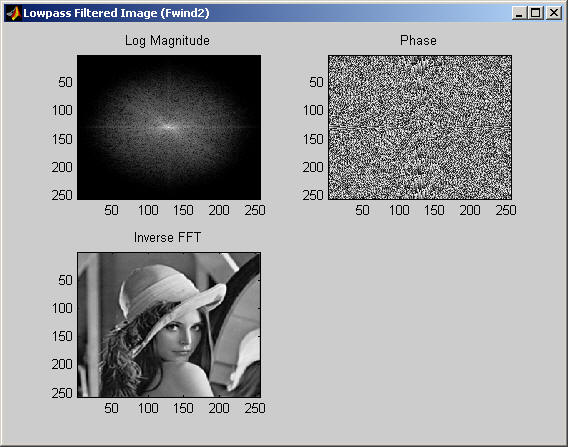
Part 2:
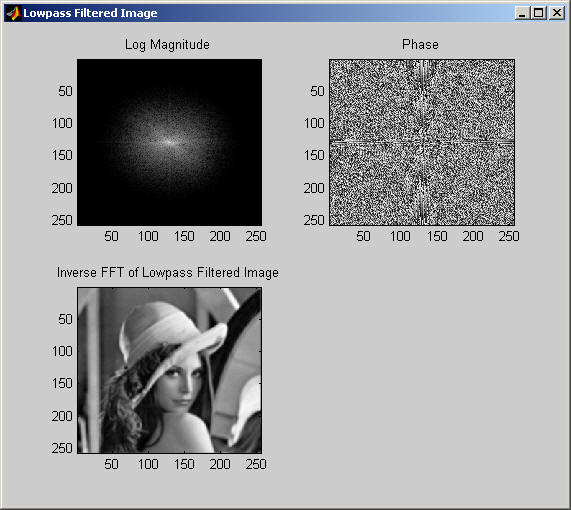
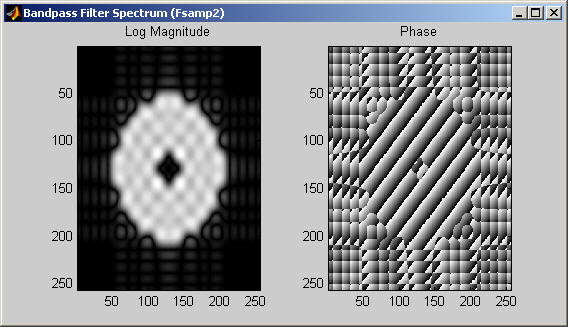
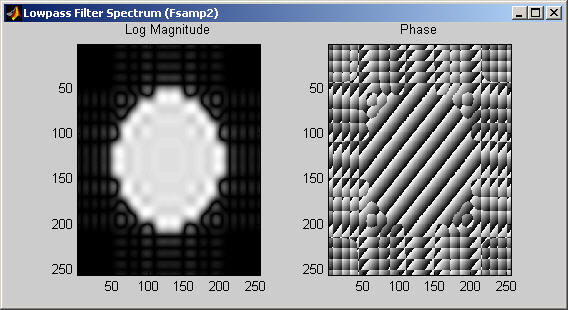
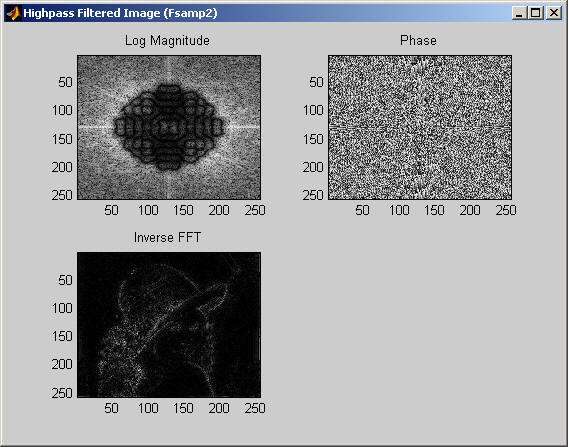
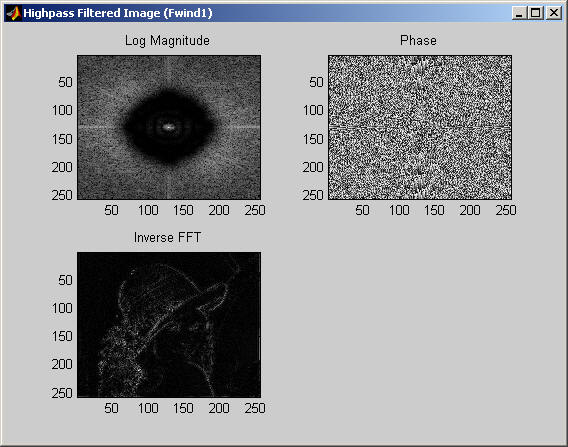
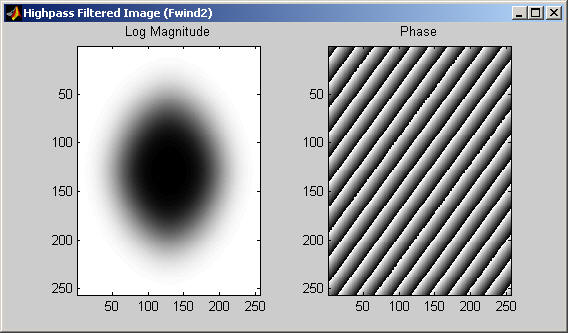
Part 3:
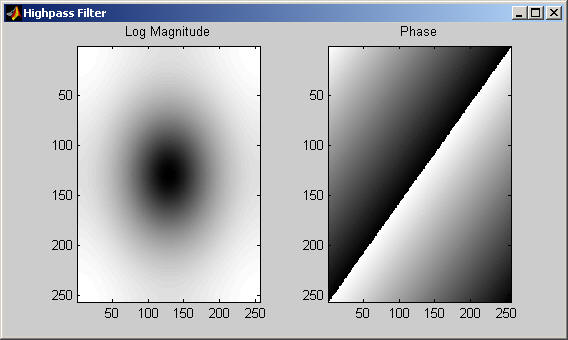
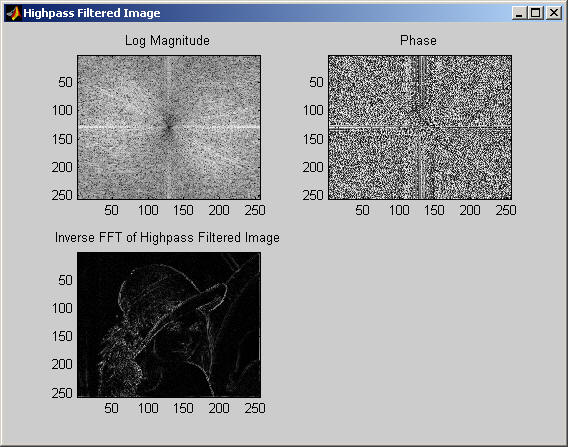
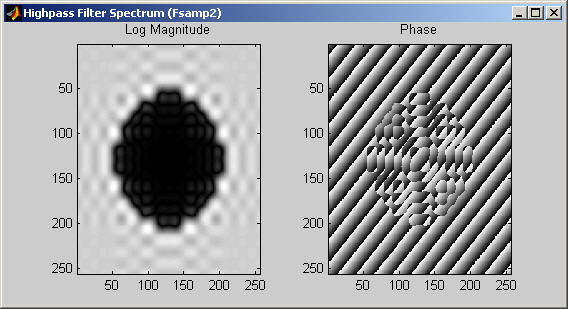
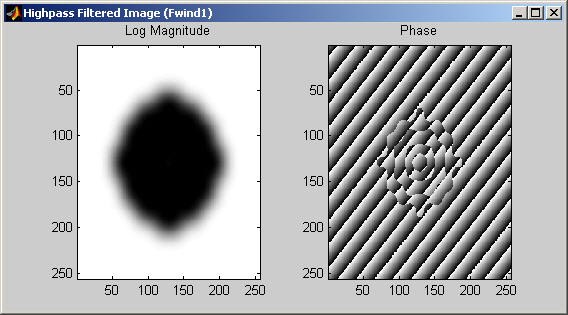
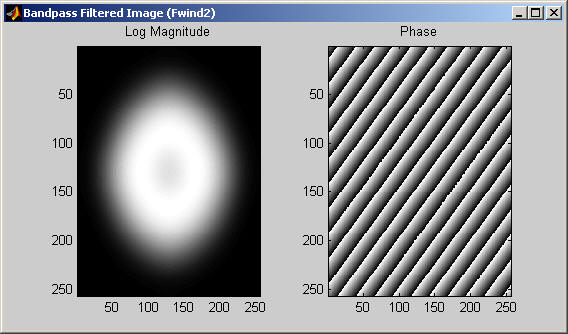
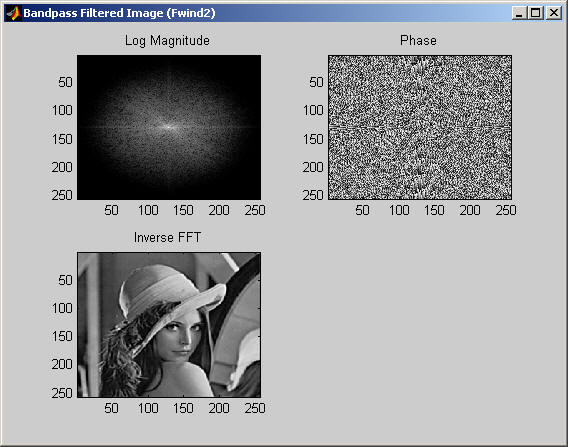
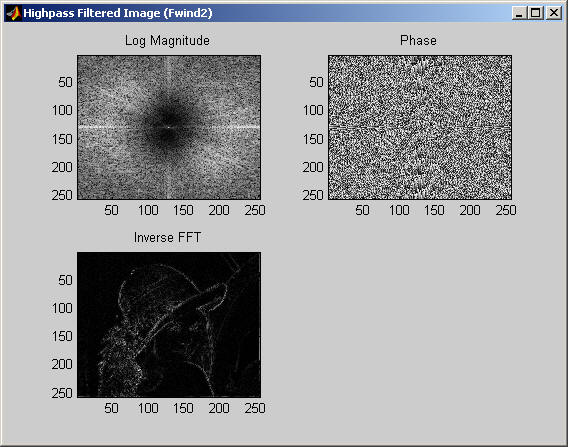
Part 4:
|
| D. |
Conclusions The Fast Fourier Transform (FFT) is the most widely known example of the Spectral method for computational problems. In Fourier transformations, the mapping is from the time-domain to the frequency-domain. The FFT is widely used in the field of image processing, where one commonly describe an image in terms of intensity values in a two-dimensional matrix. Better results can be achieved with a Gaussian shaped filter function. The advantage is that the Gaussian has the same shape in the spatial and Fourier domains and therefore does not incur the ringing effect in the spatial domain of the filtered image. A commonly used discrete approximation to the Gaussian is the Butterworth filter. Applying this filter in the frequency domain shows a similar result to the Gaussian smoothing in the spatial domain. One difference is that the computational cost of the spatial filter increases with the standard deviation (i.e. with size of the filter kernel), whereas the costs for a frequency filter are independent of the filter function. The spatial Gaussian filter is more appropriate for narrow lowpass filters, while the Butterworth filter is a better implementation for wide lowpass filters. The same principles apply to highpass filters. We obtain a highpass filter function by inverting the corresponding lowpass filter, e.g. an ideal highpass filter blocks all frequencies smaller than Do and leaves the others unchanged. The form of the filter function determines the effects of the operator. There are basically three different kinds of filters: lowpass, highpass and bandpass filters. A low-pass filter attenuates high frequencies and retains low frequencies unchanged. The result in the spatial domain is equivalent to that of a smoothing filter; as the blocked high frequencies correspond to sharp intensity changes, i.e. to the fine-scale details and noise in the spatial domain image. Bandpass filters are a combination of both
lowpass and highpass filters. They attenuate all frequencies smaller than a
frequency Do and higher than a frequency D1, while the
frequencies between the two cut-offs remain in the resulting output image. We
obtain the filter function of a bandpass by multiplying the filter functions of
a lowpass and of a highpass in the frequency domain, where the cut-off frequency
of the lowpass is higher than that of the highpass. The fwind1 function designs two-dimensional filters using the window method. fwind1 uses a one-dimensional window specification to design a two-dimensional filter based on the desired frequency response. fwind1 works with one-dimensional windows only. The fwind2 function is used to design two-dimensional filters using the window method. The fwind2 uses a two-dimensional window specification to design a two-dimensional filter based on the desired frequency response. The fwind2 works with two-dimensional windows. The fsamp2 designs two-dimensional filters based on a desired two-dimensional frequency response sampled at points on the Cartesian plane. The fsamp2, fwind1, and fwind2 functions are used to model our ideal filters in such a way that it has a realizable signal. Ideal filters cannot be physically realized. For example, the impulse response of an ideal low pass filter implies a noncausal system 1. Windowing is done to isolate part of the signal of interest. However, using a sharp truncation of a function, such as a step function, can result in spectrum-leakage distortion 1. To correct this, windowing functions are introduced to make this truncation gradual. Fwind1 and Fwind2 perform these windowing functions. |
| E. |
Appendix project3.m source code.
|
| F. |
Works Citied
1. Parr & Phillips. Signal, Systems, & Transforms. 1999: Prentice Hall. New Jersey 07458. Pages 249, 568-9. |
|
|
|