|
C.
|
Results
Original images used in this experiement.
 |
 |
|
wheel.gif |
wheelnoise.gif |
Wheel.gif Sobel
Results of experiment performed on wheel.gif
using Sobel edge detection.
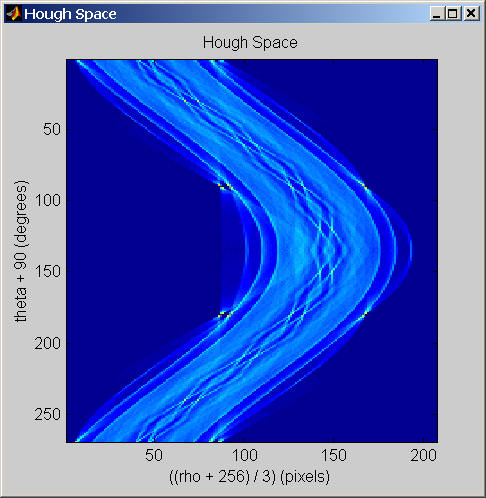
Figure 1: Hough Space of wheel.gif with Sobel edge
detection.
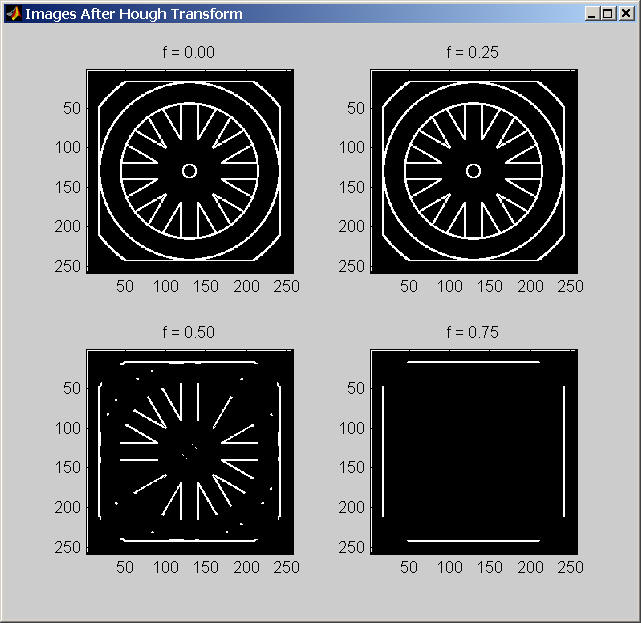
Figure 2: Results of Hough Transform
on wheel.gif with Sobel edge detection.
Four thresholds are shown here: 0.0, 0.25, 0.50, 0.75.
Our results were as expected. By inspection of the Hough
space we can see, in the middle of the Hough space, four bright areas which
represent the border of the image. Upon inspection of the output results, we can
see that as the threshold increases, the amount of lines visible in the image
decreases. This makes sense as lines containing more pixels will have higher
weights in the accumulator array. Thus, the lines displayed at the highest
threshold contain the most amount of points relative to other lines found in the
image.
Note: the original edge detected image is shown in f=0.0
in Figure 2. A threshold of 0.0 shows all lines in image which represent all
pixels.
Wheelnoise.gif Sobel
Results of experiment performed on wheelnoise.gif using
Sobel edge detection.
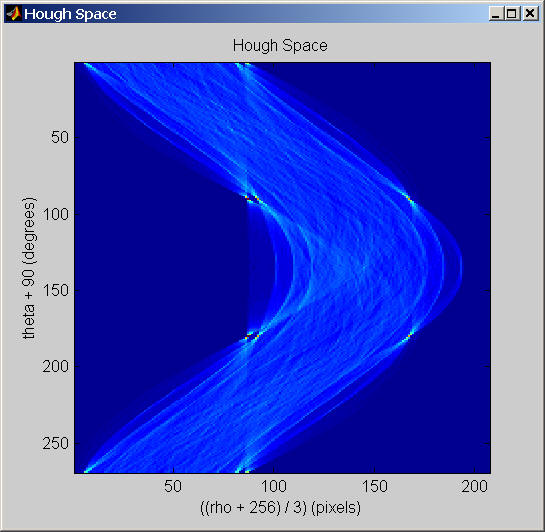
Figure 3: Hough Space of
wheelnoise.gif with Sobel edge detection.
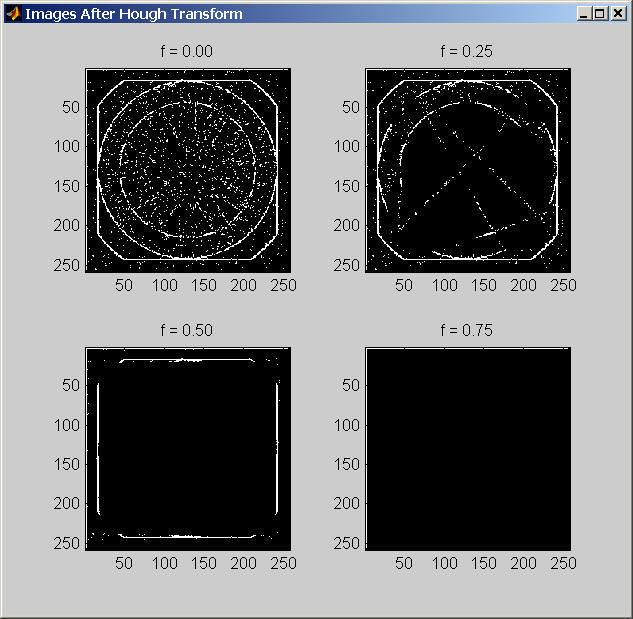
Figure 4: Results of Hough Transform
on wheelnoise.gif with Sobel edge detection.
Four thresholds are shown here: 0.0, 0.25, 0.50, 0.75.
Our results were as expected. By inspection of the Hough
space we can see, in the middle of the Hough space, four bright areas which
represent the border of the image. Upon inspection of the output results, we can
see that as the threshold increases, the amount of lines visible in the image
decreases. This makes sense as lines containing more pixels will have higher
weights in the accumulator array. Thus, the lines displayed at the highest
threshold contain the most amount of points relative to other lines found in the
image.
The noise has a great effect on the usefulness of the
Hough transform. This is depicted very well when f = 0.25 in Figure 4. The noise
falls into a line in the image and thus the Hough transform "picks it up." Only
the most predominant lines containing the most amount of pixels are shown at
high thresholds. Because of this, most of the lines are 'weeded out' at even
lower thresholds. This is shown when f = 0.50 in Figure 4.
The Hough space reflects the noise in the image. The
elliptical band in the Hough space is much smoother in Figure 1 than in Figure
3. This is due to the fact that the transform can find no concentrated lines at
a particular rho and theta because of the noise. The noise 'spread out' these
lines and thus yields the smoother band as shown in Figure 3.
Note: the original edge detected image is shown in f=0.0
in Figure 4. A threshold of 0.0 shows all lines in image which represent all
pixels.
Wheel.gif Canny
Results of experiment performed on wheel.gif using Canny
edge detection.

Figure 5: Hough Space of wheel.gif
with Canny edge detection.
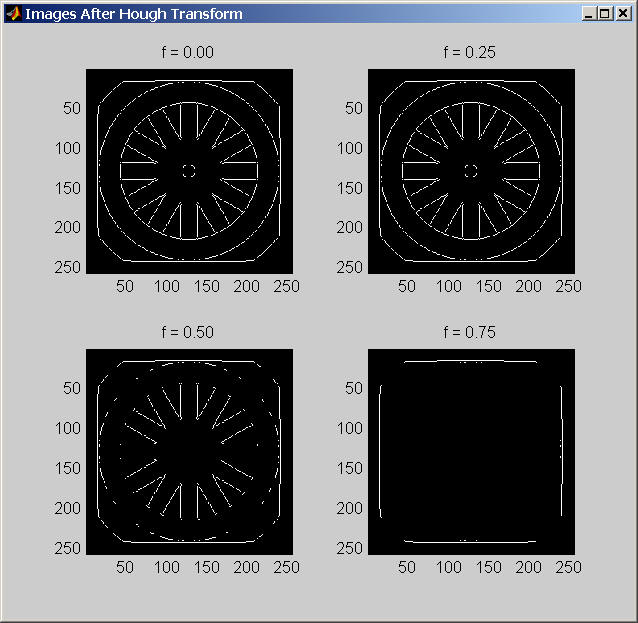
Figure 6: Results of Hough Transform
on wheel.gif with Canny edge detection.
Four thresholds are shown here: 0.0, 0.25, 0.50, 0.75.
Our results were as expected. By inspection of the Hough space we can see,
in the middle of the Hough space, four bright areas which represent the border
of the image. Upon inspection of the output results, we can see that as the
threshold increases, the amount of lines visible in the image decreases. This
makes sense as lines containing more pixels will have higher weights in the
accumulator array. Thus, the lines displayed at the highest threshold contain
the most amount of points relative to other lines found in the image.
Canny edge detection works very well on images with well
defined regions. Because of this, you can clearly see the amount of lines shown
in Figure 6 decreases as the threshold increases.
Note: the original edge detected image is shown in f=0.0 in
Figure 6. A threshold of 0.0 shows all lines in image which represent all
pixels.
Summary
All results were as expected in the experiment. |
|
E. |
Appendix
Source Code
wheel.m source code.
wheel_noise.m source code.
wheel_canny.m source code.
imdetectedges.m source code.
Wheel.m
%-------------------------------------------------------------------------------

% Project 3

% Group 8

% Isaac Gerg (idg101)

% CSE 486

%-------------------------------------------------------------------------------


clc;

close all;


%-------------------------------------------------------------------------------

% Read in images

imgWheel = imread('wheel.gif', 'gif');


%-------------------------------------------------------------------------------

% Part a - Sobel Edge Detection

imgWheel_SobelEdgeDetection = imdetectedges( imgWheel, 'sobel', 0.08);

imwrite(imgWheel_SobelEdgeDetection, 'wheel_sobel.jpg', 'jpg');


%-------------------------------------------------------------------------------

% Part b - Hough Transform

disp('Running voting algorithm...');


E = imgWheel_SobelEdgeDetection;

d_rho = 3; % 0 <= rho <= 363

d_theta = 1; % -pi/2 < theta < pi

Rmin = -256;

Rmax = 365;

R = Rmax - Rmin; % Adding 0 instead of 1 so array A has integer height.

Tmin = -89;

Tmax = 179;

T= Tmax - Tmin + 1; % Add 1 to account for zero.

% Conversion factors

toRadians = pi/180;

toDegrees = 180/pi;


% Initialize A(R,T), P

% A is accumulator, P is the list of pixels that voted for a particular point.

A = zeros(T / d_theta , R / d_rho);

P = cell(T / d_theta , R / d_rho);


for i = 1:258,

for j = 1:258,

for h = Tmin:Tmax,

if E(i,j) == 255

rho = i*cos(h*d_theta*toRadians) + j*sin(h*d_theta*toRadians) - Rmin;

k = round((rho)/d_rho) + 1;

A(h + 90, k) = A(h + 90, k) + 1;

mxTmp = P{h + 90, k};

P{h + 90, k} = [mxTmp; i j];

end

end

end

end


disp('Done.');


%-------------------------------------------------------------------------------

% Part c - Display Hough Transform

disp('Creating image from hough space...');


iMin = min(min(A));

iMax = max(max(A));


% ---- f = 0.0 ----

f = 0.00;

intT = iMin + f * (iMax - iMin);


imgHough0_0 = zeros(258, 258);


for theta = 1:(T / d_theta),

for rho = 1:(R / d_rho),

if A(theta, rho) > intT

mxTmp = P{theta, rho};

for i = 1:A(theta, rho),

imgHough0_0(mxTmp(i,1), mxTmp(i,2)) = 255;

end

end

end

end


% ---- f = 0.25 ----

f = 0.25;

intT = iMin + f * (iMax - iMin);


imgHough0_25 = zeros(258, 258);


for theta = 1:(T / d_theta),

for rho = 1:(R / d_rho),

if A(theta,rho) > intT

mxTmp = P{theta, rho};

for i = 1:A(theta, rho),

imgHough0_25(mxTmp(i,1), mxTmp(i,2)) = 255;

end

end

end

end


% ---- f = 0.50 ----

f = 0.50;

intT = iMin + f * (iMax - iMin);


imgHough0_50 = zeros(258, 258);


for theta = 1:(T / d_theta),

for rho = 1:(R / d_rho),

if A(theta,rho) > intT

mxTmp = P{theta, rho};

for i = 1:A(theta, rho),

imgHough0_50(mxTmp(i,1), mxTmp(i,2)) = 255;

end

end

end

end


% ---- f = 0.75 ----

f = 0.75;

intT = iMin + f * (iMax - iMin);


imgHough0_75 = zeros(258, 258);


for theta = 1:(T / d_theta),

for rho = 1:(R / d_rho),

if A(theta,rho) > intT

mxTmp = P{theta, rho};

for i = 1:A(theta, rho),

imgHough0_75(mxTmp(i,1), mxTmp(i,2)) = 255;

end

end

end

end


disp('Done.');

figure('Name', 'Images After Hough Transform', 'NumberTitle', 'off', 'MenuBar',
'none');

colormap('gray');

subplot(2,2,1);

imagesc(imgHough0_0);

title('f = 0.00');

subplot(2,2,2);

imagesc(imgHough0_25);

title('f = 0.25');

subplot(2,2,3);

imagesc(imgHough0_50);

title('f = 0.50');

subplot(2,2,4);

imagesc(imgHough0_75);

title('f = 0.75');


imwrite(imgHough0_0, 'wheel_hough_transform0_0.jpg', 'jpg');

imwrite(imgHough0_25, 'wheel_hough_transform0_25.jpg', 'jpg');

imwrite(imgHough0_50, 'wheel_hough_transform0_50.jpg', 'jpg');

imwrite(imgHough0_75, 'wheel_hough_transform0_75.jpg', 'jpg');


%-------------------------------------------------------------------------------

% Part d - Display Hough Transform


figure('Name', 'Hough Space', 'NumberTitle', 'off', 'MenuBar', 'none');

imagesc(A);

title('Hough Space');

xlabel('((rho + 256) / 3) (pixels)');

ylabel('theta + 90 (degrees)');
Wheel_Canny.m
%-------------------------------------------------------------------------------

% Project 3

% Group 8

% Isaac Gerg (idg101)

% CSE 486

%-------------------------------------------------------------------------------


clc;

close all;


%-------------------------------------------------------------------------------

% Read in images

imgWheelCanny = imread('wheel.gif', 'gif');


%-------------------------------------------------------------------------------

% Part a - canny Edge Detection

imgWheelCanny_EdgeDetection = imdetectedges( imgWheelCanny, 'canny', 0.0);

imwrite(imgWheelCanny_EdgeDetection, 'WheelCanny.jpg', 'jpg');


%-------------------------------------------------------------------------------

% Part b - Hough Transform

disp('Running voting algorithm...');


E = imgWheelCanny_EdgeDetection;

d_rho = 3; % 0 <= rho <= 363

d_theta = 1; % -pi/2 < theta < pi

Rmin = -256;

Rmax = 365;

R = Rmax - Rmin; % Adding 0 instead of 1 so array A has integer height.

Tmin = -89;

Tmax = 179;

T= Tmax - Tmin + 1; % Add 1 to account for zero.

% Conversion factors

toRadians = pi/180;

toDegrees = 180/pi;


% Initialize A(R,T), P

% A is accumulator, P is the list of pixels that voted for a particular point.

A = zeros(T / d_theta , R / d_rho);

P = cell(T / d_theta , R / d_rho);


for i = 1:256,

for j = 1:256,

for h = Tmin:Tmax,

if E(i,j) > 0.5

rho = i*cos(h*d_theta*toRadians) + j*sin(h*d_theta*toRadians) - Rmin;

k = round((rho)/d_rho) + 1;

A(h + 90, k) = A(h + 90, k) + 1;

mxTmp = P{h + 90, k};

P{h + 90, k} = [mxTmp; i j];

end

end

end

end


disp('Done.');

figure('Name', 'Hough Space', 'NumberTitle', 'off', 'MenuBar', 'none');

imagesc(A);

title('Hough Space');

xlabel('((rho + 256) / 3) (pixels)');

ylabel('theta + 90 (degrees)');


%-------------------------------------------------------------------------------

% Part c - Display Hough Transform

disp('Creating image from hough space...');


iMin = min(min(A));

iMax = max(max(A));


% ---- f = 0.0 ----

f = 0.00;

intT = iMin + f * (iMax - iMin);


imgHough0_0 = zeros(256, 256);


for theta = 1:(T / d_theta),

for rho = 1:(R / d_rho),

if A(theta, rho) > intT

mxTmp = P{theta, rho};

for i = 1:A(theta, rho),

imgHough0_0(mxTmp(i,1), mxTmp(i,2)) = 255;

end

end

end

end


% ---- f = 0.25 ----

f = 0.25;

intT = iMin + f * (iMax - iMin);


imgHough0_25 = zeros(256, 256);


for theta = 1:(T / d_theta),

for rho = 1:(R / d_rho),

if A(theta,rho) > intT

mxTmp = P{theta, rho};

for i = 1:A(theta, rho),

imgHough0_25(mxTmp(i,1), mxTmp(i,2)) = 255;

end

end

end

end


% ---- f = 0.50 ----

f = 0.50;

intT = iMin + f * (iMax - iMin);


imgHough0_50 = zeros(256, 256);


for theta = 1:(T / d_theta),

for rho = 1:(R / d_rho),

if A(theta,rho) > intT

mxTmp = P{theta, rho};

for i = 1:A(theta, rho),

imgHough0_50(mxTmp(i,1), mxTmp(i,2)) = 255;

end

end

end

end


% ---- f = 0.75 ----

f = 0.75;

intT = iMin + f * (iMax - iMin);


imgHough0_75 = zeros(256, 256);


for theta = 1:(T / d_theta),

for rho = 1:(R / d_rho),

if A(theta,rho) > intT

mxTmp = P{theta, rho};

for i = 1:A(theta, rho),

imgHough0_75(mxTmp(i,1), mxTmp(i,2)) = 255;

end

end

end

end


disp('Done.');

figure('Name', 'Images After Hough Transform', 'NumberTitle', 'off', 'MenuBar',
'none');

colormap('gray');

subplot(2,2,1);

imagesc(imgHough0_0);

title('f = 0.00');

subplot(2,2,2);

imagesc(imgHough0_25);

title('f = 0.25');

subplot(2,2,3);

imagesc(imgHough0_50);

title('f = 0.50');

subplot(2,2,4);

imagesc(imgHough0_75);

title('f = 0.75');


imwrite(imgHough0_0, 'WheelCanny_hough_transform0_0.jpg', 'jpg');

imwrite(imgHough0_25, 'WheelCanny_hough_transform0_25.jpg', 'jpg');

imwrite(imgHough0_50, 'WheelCanny_hough_transform0_50.jpg', 'jpg');

imwrite(imgHough0_75, 'WheelCanny_hough_transform0_75.jpg', 'jpg');
Wheel_noise.m
%-------------------------------------------------------------------------------

% Project 3

% Group 8

% Isaac Gerg (idg101)

% CSE 486

%-------------------------------------------------------------------------------


clc;

close all;


%-------------------------------------------------------------------------------

% Read in images

imgwheelnoise = imread('wheelnoise.gif', 'gif');


%-------------------------------------------------------------------------------

% Part a - Sobel Edge Detection

imgwheelnoise_SobelEdgeDetection = imdetectedges( imgwheelnoise, 'sobel', 0.29);

imwrite(imgwheelnoise_SobelEdgeDetection, 'wheelnoise_sobel.jpg', 'jpg');


%-------------------------------------------------------------------------------

% Part b - Hough Transform

disp('Running voting algorithm...');


E = imgwheelnoise_SobelEdgeDetection;

d_rho = 3; % 0 <= rho <= 363

d_theta = 1; % -pi/2 < theta < pi

Rmin = -256;

Rmax = 365;

R = Rmax - Rmin; % Adding 0 instead of 1 so array A has integer height.

Tmin = -89;

Tmax = 179;

T= Tmax - Tmin + 1; % Add 1 to account for zero.

% Conversion factors

toRadians = pi/180;

toDegrees = 180/pi;


% Initialize A(R,T), P

% A is accumulator, P is the list of pixels that voted for a particular point.

A = zeros(T / d_theta , R / d_rho);

P = cell(T / d_theta , R / d_rho);


for i = 1:258,

for j = 1:258,

for h = Tmin:Tmax,

if E(i,j) == 255

rho = i*cos(h*d_theta*toRadians) + j*sin(h*d_theta*toRadians) - Rmin;

k = round((rho)/d_rho) + 1;

A(h + 90, k) = A(h + 90, k) + 1;

mxTmp = P{h + 90, k};

P{h + 90, k} = [mxTmp; i j];

end

end

end

end


disp('Done.');

figure('Name', 'Hough Space', 'NumberTitle', 'off', 'MenuBar', 'none');

imagesc(A);

title('Hough Space');

xlabel('((rho + 256) / 3) (pixels)');

ylabel('theta + 90 (degrees)');


%-------------------------------------------------------------------------------

% Part c - Display Hough Transform

disp('Creating image from hough space...');


iMin = min(min(A));

iMax = max(max(A));


% ---- f = 0.0 ----

f = 0.00;

intT = iMin + f * (iMax - iMin);


imgHough0_0 = zeros(258, 258);


for theta = 1:(T / d_theta),

for rho = 1:(R / d_rho),

if A(theta, rho) > intT

mxTmp = P{theta, rho};

for i = 1:A(theta, rho),

imgHough0_0(mxTmp(i,1), mxTmp(i,2)) = 255;

end

end

end

end


% ---- f = 0.25 ----

f = 0.25;

intT = iMin + f * (iMax - iMin);


imgHough0_25 = zeros(258, 258);


for theta = 1:(T / d_theta),

for rho = 1:(R / d_rho),

if A(theta,rho) > intT

mxTmp = P{theta, rho};

for i = 1:A(theta, rho),

imgHough0_25(mxTmp(i,1), mxTmp(i,2)) = 255;

end

end

end

end


% ---- f = 0.50 ----

f = 0.50;

intT = iMin + f * (iMax - iMin);


imgHough0_50 = zeros(258, 258);


for theta = 1:(T / d_theta),

for rho = 1:(R / d_rho),

if A(theta,rho) > intT

mxTmp = P{theta, rho};

for i = 1:A(theta, rho),

imgHough0_50(mxTmp(i,1), mxTmp(i,2)) = 255;

end

end

end

end


% ---- f = 0.75 ----

f = 0.75;

intT = iMin + f * (iMax - iMin);


imgHough0_75 = zeros(258, 258);


for theta = 1:(T / d_theta),

for rho = 1:(R / d_rho),

if A(theta,rho) > intT

mxTmp = P{theta, rho};

for i = 1:A(theta, rho),

imgHough0_75(mxTmp(i,1), mxTmp(i,2)) = 255;

end

end

end

end


disp('Done.');

figure('Name', 'Images After Hough Transform', 'NumberTitle', 'off', 'MenuBar',
'none');

colormap('gray');

subplot(2,2,1);

imagesc(imgHough0_0);

title('f = 0.00');

subplot(2,2,2);

imagesc(imgHough0_25);

title('f = 0.25');

subplot(2,2,3);

imagesc(imgHough0_50);

title('f = 0.50');

subplot(2,2,4);

imagesc(imgHough0_75);

title('f = 0.75');


imwrite(imgHough0_0, 'wheelnoise_hough_transform0_0.jpg', 'jpg');

imwrite(imgHough0_25, 'wheelnoise_hough_transform0_25.jpg', 'jpg');

imwrite(imgHough0_50, 'wheelnoise_hough_transform0_50.jpg', 'jpg');

imwrite(imgHough0_75, 'wheelnoise_hough_transform0_75.jpg', 'jpg');
Time Utilization
Isaac spent 9.5 hours on this project. Adam spent 1.5 hours
on this project. Jamie spent 0 hours on this project.
|